CHAPTER III-11
POST-FLOOD DAMAGE ASSESSMENT PROTOCOL
INTRODUCTION
After a flood, the primary activity for a community is assessing the damage and recovering. This time, however, also affords the opportunity to gather data that will improve the tools for evaluating future flood risks and possible alternatives to reducing those risks. Potential data to collect includes aerial mapping of the flood at or near its peak crest, setting high water marks, collecting rainfall distribution data, and comparing high water marks and inundated areas with how the risk areas associated with a similar type of an event are delineated on existing FIRMs. While this section was not a part of the 1995 Master Plan, the additional experience with flood events since that time and better available data due to technological advances, has precipitated the need to have this topic addressed for the benefit of the communities in the basin. Topics addressed are damage assessment, aerial mapping, high water marks, rainfall data collection, and comparison of flooded areas to the FIRMs.
1995 MASTER PLAN REVISITED
Post flood activities were not addressed in the 1995 Master Plan.
MRBC and MRBC COMMUNITY ACCOMPLISHMENTS
Even though post flood activities were not addressed in the 1995 Master Plan, elements of such activities have been done on an informal basis and have already proved useful. For example, aerial photography taken during the 2003 flood in the City of Decatur along with high water marks set by IDNR as well as the City of Decatur proved useful in recalibrating the hydraulic model of the St. Marys River to improve the floodplain delineations and better identify the associated flood risks. If no post flood assessment had been done, there would have been no identification of the error in the then effective flood profiles.
MRBC has worked with the City of Fort Wayne to develop and implement a process to assess flood damage. They have identified appropriate Departments to carry out each task based on their system of organization.
2008 MASTER PLAN ENHANCEMENTS
Damage Assessments
In order to help communities carry out their post flood responsibilities, IDNR has published a document titled “Flooding and Post-Disaster Responsibilities, A Local Administrator’s Guide”. This document has sample forms that can be used to accomplish the community’s required activities. A copy of the report can be viewed at the Indiana Department of Natural Resources - Division of Water website. Fort Wayne has already developed a process for their damage assessments as noted above. For other MRBC communities, a flow chart has been created from the IDNR document to assist in post flood damage assessment responsibilities. It is the Floodplain Administrator’s responsibility to see that this process is carried out and documentation is appropriately gathered and cataloged. The Floodplain Administrator does not have to do all this alone. He or she has the option of contacting people such as the local Emergency Management Agency Director, local building inspectors, County surveyor, or other appropriate personnel who may be available and qualified to become part of the Damage Assessment team and aid in completing the needed flood damage assessments.
As a team is assembled, the Floodplain Manager should also be gathering items for the Damage Assessment team to use. This would include, but not be limited to, copies of applicable FIRMs, locations of flooded structures, blank copies of damage assessment forms (IDNR’s Local Administrator’s Guide has sample copies of these forms), blank High Water Mark forms (see example copy and instructions), copies of a Damage Notice or door hanger printed on high visibility card stock to be placed on each structure (template Damage Notice is include in IDNR Local Administrator’s Guide) and cameras. As damaged areas become safe to reenter, the Damage Assessment team is then ready to deploy. The Floodplain Administrator should at this time provide a news release to alert residents to the need for appropriate permits before any repairs can occur. A sample news release is also included in the IDNR Local Administrator’s Guide noted above.
The flow chart below (Click to enlarge) illustrates the process to follow for each structure so owners can be made aware of the process, appropriate building requirements can be enforced to reduce future flood damages, and applicable documentation is obtained for grant application submittals. The Category A, B, and C letters and notifications noted in the flow chart are described following the chart. The Floodplain Administrator can assign applicable personnel to each task as they coordinate the process.
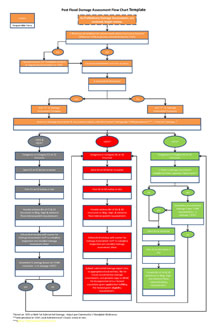
Category A structures - Letter to the owner and the list to the Building Department should inform them that they MAY proceed with repairs as long as they obtain the necessary permits form the local Building Department. If the structure is Category A2, it should be noted that a permit from IDNR for Construction in a Floodway will also be required and the structure will be required to satisfy the NFIP requirements.
Category B structures - Letter to the owner and the list to the Building Department should inform them that they MAY NOT commence any repair until they have presented an elevation plan, a certified Elevation Certificate (form and instructions available at http://www.fema.gov/pdf/ nfip/elvcert.pdf), and any other required information to the local Building official and obtained the necessary local Building Department permits. If the structure is Category B2, it should be noted that a permit from IDNR for Construction in a Floodway will also be required.
Category C structures - Letter to the owner and the list to the Building Department should inform them that they MAY NOT commence any repair until the Floodplain Administrator has had an opportunity to perform a detailed Damage Assessment and reclassify as Category A or B.
Aerial photography
Aerial photography can be captured in several different forms. There are companies that conduct aerial photography for a fee. Sometimes, a local pilot is curious enough to fly over the flooded area and could take passengers with cameras such as was the case for the photo below from the 2003 flood in Decatur. A community could maintain a list of possible pilot or company contacts during a flood to make arrangements for such a fly over. Local news media are often willing to cooperate and even cost-share on a fly over of flooded areas. Video taken by the media is often of greater quality and most markets are willing to share with community officials. Cooperating with the local news media can prove to be a valuable tool when the need arises to distribute a message to local flood victims.
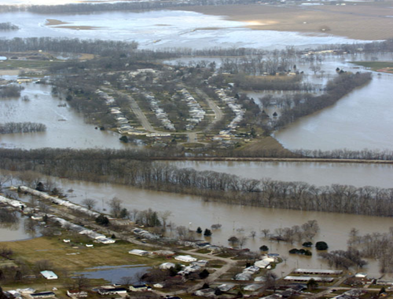
Such photos provide information on approximate areas affected by the flooding. This data can be used immediately to locate areas needing assistance. They can also be used for improving the FIRMs that are used to regulate development in the floodplain. The more realistic those FIRMs appear, the better tool they become. In the case of the photo above, the photos helped to document that some of the flood water bypassed the bridge over the stream, circled an area of higher ground, and reentered the main stream via a tributary downstream. To make the photos valuable in the future, they need to be labeled with the location and date and time (real time and time in relation to the peak) of the photography. It is critical to photograph areas and / or objects where the “high water” demarcation can be “field surveyed” after the floodwaters recede and crews have time to work such tasks into their schedule. Noting the location and direction of the photos on a map is a useful way of cataloging the pictures.
When a community within the MRBC jurisdiction undertakes flood photography for the purpose of documenting flood elevations and extents, plans should be coordinated with MRBC. Because MRBC is a Cooperating Technical Partner (CTP) for FEMA, any Physical Map Revisions would be coordinated through MRBC. It is therefore critical that MRBC have knowledge of the available data and any plans to seek a redelineation of the flood hazard. Including MRBC in the process also allows for consistency in data collection and documentation as well as providing an opportunity for cost savings if multiple areas can be photographed during the same flight.
High Water Marks
The Indiana Department of Natural Resources (IDNR) has a system whereby they deploy available staff to set high water marks as soon as possible after a flood event. High water marks are no more than a nail set in a tree, a crow’s foot scribed on a bridge abutment, a paint mark on street pavement, or a distance down or up from some physical feature noted, then describing the location and having a surveyor tie in the elevation at a later date. It is extremely crucial to document the date and time that the high water mark was set so that post-flood analysis can be performed. This information is kept on file and used later for a variety of purposes. The main purpose is to calibrate hydraulic models.
High water marks set by IDNR were used to calibrate the St. Marys River hydraulic model after the 2003 flood. The 2003 flood had a discharge similar to the 1% annual chance event flood but had flood elevations higher than those shown on the Flood Insurance Rate Maps (FIRMs). For this record event, the City of Decatur had also set some high water marks by contracting with a local private surveyor. These marks proved useful in supplementing the IDNR high water marks and creating a more realistic model. Because of the high water marks, the FIRM, revised based on the calibrated model, is now a better representation of expected flood risks and therefore a better tool for mitigating and reducing those risks.
When flooding is only in a small area, IDNR has the staff to set the high water marks. When flooding is more widespread, however, local communities could benefit themselves by assisting in the high water mark setting process. Local officials are already on site and could document flood crest elevations while they carry on their other responsibilities. Even if only a few representative locations are documented, valuable information has been provided. Consideration should be given to setting marks upstream and downstream of areas such as bridges or other structures that are of interest in regards to their effect on flood elevations.
These high water marks should, at the very least, be kept on file with the community for use in the future. In the case of communities within the Maumee River basin, it is recommended that a copy of the marks be kept on file in the MRBC office. This would increase the likelihood of them being remembered and available when useful in the future. Additional flood related information such as ground photos, aerial photography, rainfall data, information news articles, etc. collected and kept on file could prove useful in the future as well.
A process could also be established with IDNR whereby the high water marks would be submitted to them to add to their data base. This would be the ideal situation so that they are available to the widest audience that may have need for them. A copy of the IDNR High Water Mark form and instructions for filling it out can be found at the end of this chapter. If a community plans to set high water marks, contact should be made with the North Basin Section Team Leader at the IDNR Division of Water (317-232-4160) in order to coordinate and maximize efforts. IDNR may be able to either set and document the marks, or tie them into an appropriate vertical datum, or serve as a repository for the information, or any combination of these activities.
Rainfall and Hydrology Related Data Collection
Rainfall data including depth for the whole storm as well as depth per hour is collected at a few stations within the basin. However, this data is often not refined enough to accurately calibrate hydrologic models. Often the data can be obtained for a short period after the rain event but then is lost due to storage space limitations. This data should therefore be obtained soon after the flood and preserved for future reference. Again, it is recommended that the data be kept at the community level as well as in the MRBC office.
The following website resources are useful when collecting data related to large storm events. The discussion below is intended to summarize available tools and resources associated with various hydrologic and precipitation related websites. It does not identify all tools and data sources available on these websites. The information and tools available on these websites should be further explored in order to gain a greater understanding of their functionality.
- Community Collaborative Rain Hail & Snow Network (CoCoRaHS)
CoCoRaHS is community-based network of volunteers working together to measure and map precipitation. The website allows users to query a variety of reports and data for county specific precipitation information including daily precipitation, intense precipitation, and multi-day precipitation.
Directions for Accessing County Specific Precipitation Data
- Select the county of interest on the state map
- Select the county report of interest (Daily Precip, Hail Reports, Intense Precip, and Multi-Day Precip).
- Select the date of interest.
- Click the “Get Reports” lin
- Indiana State Climate Office
The Indiana State Climate Office (Iclimate) is the state archive of official daily and hourly weather observations recorded throughout Indiana. Iclimate maintains an online archive of many recent daily and hourly observations from both manual and automated networks.
- Navigate to the menu on left side of page to the “Data Request” option. This will provide users with the following options.
- Automated Data
- Data Request Form
Directions for Accessing Automated Data
Directions for Accessing Data Request Form
- Under the “Data Request” option, select the “Automated Data” option.
- Select date range of interest
- If county information is available, select county for faster retrieval of dataset.
- Use browser other than Internet Explorer if you are interested to view stations from different counties, at the same time.
- Under the “Data Request” option, select the “Data Request Form” option.
- Complete the Data Request Form. At a minimum, identify your Email address, the geographical location of the data you are interested in, the data needed, and the period of interest.
- Email response is reliable.
- National Weather Service Weather Forecast Office – Indianapolis, IN
Among other things, this website provides local forecasts, information on local weather watches and warnings, as well as local precipitation observations from across the state for the previous seven days.
Directions for Accessing State Wide Precipitation Maps
- Click the “Observations” tab.
- Click on the “Maps of Precipitation from Cooperative Observers” link.
- Scroll to the “Daily Coop Precipitation
- Maps” section.
- Click on the day of the week of interest.
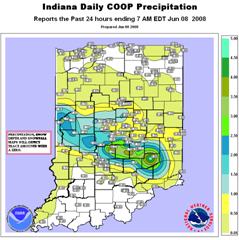
This will provide users with maps detailing 24 hour precipitation totals for the previous seven days, such as the one shown below
.
- National Weather Service – Advanced Hydrologic Prediction Service –Precipitation Analysis
This website graphically shows the short-term observed and climatic trends of precipitation across the lower 48 United States and Puerto Rico. This website allows user to view and download current and archived precipitation maps and data.
Map Generation Instructions
Data Download Instructions
- Click on “Download” tab.
- Select format of interest (Shapefile, netCDF).
- Select download of interest (Continental U.S. & Puerto Rico, Legend File)
- Select date of interest
- Click the “Download Button” - Among other fields, downloaded shapefiles will contain 24 hour precipitation values in inches.
- National Weather Service – Advanced Hydrologic Prediction Service (AHPS)
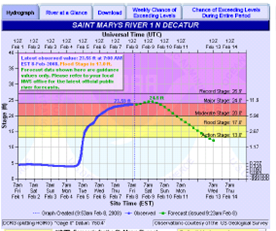
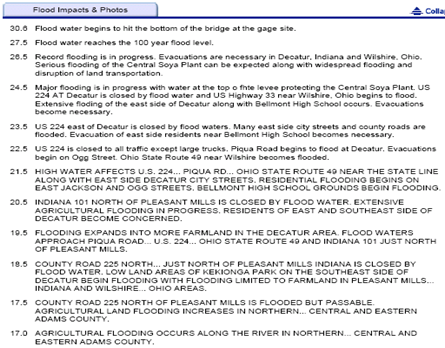
AHPS displays the magnitude and uncertainty of occurrence of floods or droughts, from hours to days and months, in advance. Among other things, information such as the flood forecast level and time of peak or crest, is provided through hydrographs as shown here. Expected impacts in the floodplain are also described for various flood stages at the gauge and values for conversion of gauge heights to NAVD elevations to allow comparison of expected elevations to the affected FIRM panel and the 1% annual chance flood elevations. See the example below.
River Stage
Reference FrameGauge Height Flood Stage Uses NWS stage 0 ft 17 ft Interpreting hydrographs and NWS watch, warnings, and forecasts, and inundation maps Vertical Datum Elevation
(gauge height = 0)Elevation
(gauge height = flood stage)Elevation information source NAVD88 N/A N/A Survey grade GPS equipment, FEMA flood plain maps, newer USGS topographic maps NGVD 29 760.44 ft 777.44 ft Older USGS topographic maps, NGVD29 benchmarks MSL N/A N/A Older USGS topographic maps, MSL benchmarks Other N/A N/A Instructions for Accessing Hydrographs, Historical Crests, Flood Impacts, and Tabular Data for Individual Gauges
- Click the national map to zoom to area of interest.
- Select stream gauges of interest to access latest hydrograph and additional data for that gauge. Additional date includes some expected impacts such as road closures or flooded areas at a given stage on the gauge.
- Select “Printable Image” to download the hydrograph as a PDF.
- Select “Tabular Data” to download data related to stage and discharge for gauge of interest.
Instructions for Accessing Hydrographs and Tabular Data for Entire Rivers
- Click the national map to zoom to area of interest.
- Select a stream gauge on the river of interest.
- Select the “River at a Glance” tab.
- Select points of interest.
- Select information of interest.
- Click the “Make My River Page” button. – This will provide the selected data for each of the selected gauges
Comparison of Flooded Areas to FIRMs
Flood events also provide a good opportunity to compare Flood Insurance Rate Map delineations with inundated areas. If large discrepancies are found, it could indicate that the mapping used for the floodplain delineation or the data used for the hydraulic or hydrologic modeling were not detailed enough or accurate. Noting differences is good documentation for either showing the need for the community to pursue a Letter of Map Revision or to have documentation to provide to the State for selecting and prioritizing revisions under the Floodplain Map Modernization Program. Noted discrepancies should be communicated to MRBC due to its role as CTP for communities under its jurisdiction.
RECOMMENDATIONS
MRBC should:
-
Assist and encourage each community in the basin to establish post flood damage assessment processes that include the items in the Damage Assessment Process Template presented in this chapter.
-
Coordinate with and assist communities in obtaining and cataloging aerial photography at or near the peak of a major flood and, at the very least, be provided by the community with a list of the photography that was obtained.
-
Coordinate with and assist communities in collecting pertinent rainfall and other hydrology related data as soon as possible after a major flood event and serving as a repository for such documentation.
-
Assist communities in establishing a process for working in coordination with MRBC and IDNR to document high water marks after significant floods.
-
Establish a system of coordination with communities that could benefit by comparing actual flooded areas during a major flood to the floodplains outlined on the FIRMs to determine any significant discrepancies.
-
Coordinate with communities in cataloging and archiving collected flood event related data.
![]()
Other Information
![]()
THIS SITE IS BEST VIEWED IN MICROSOFT INTERNET EXPLORER 6.0 OR HIGHER